A BMS runs the building. We automate running it.
We put an AI layer on top of the BMS you already have. It works around the clock: detecting faults, finding the root cause, drafting the work order and sending notifications and reports by WhatsApp and email.
- Chillers
- AHUs
- Pumps
- Meters
A BMS runs the building, not the operations
The missing piece is an operations layer above the BMS: always on, driven by data and connected to maintenance.
Alarm overload
Alarm floods bury the few events that matter, so operators react to noise instead of root causes.
Reactive maintenance
Faults surface after comfort complaints or breakdowns, and work orders are raised by hand with little context.
Manual reporting
Reports take days to compile, which makes savings and compliance hard to prove.
One platform on top of your existing BMS
Vendor-neutral: it connects to the BMS you already run, with no controller replacement and read-only access by default.
- Operators
- Facility managers
- CMMS / ticketing
- Management reports
- Fault detection & diagnostics
- Alarm & work-order automation
- Analytics & dashboards
- AI agents & reporting
- BACnet
- Modbus
- OPC UA
- Niagara
- APIs
- BMS
- Chillers & AHUs
- Pumps & VFDs
- Energy meters
- IoT sensors
A continuous loop from data to action
Every action is verified and fed back into the next cycle.
Connect
Read live data from the BMS, meters and IoT sensors.
Detect
Spot faults, anomalies and out-of-range readings automatically.
Diagnose
Link each symptom to its most probable root cause.
Act
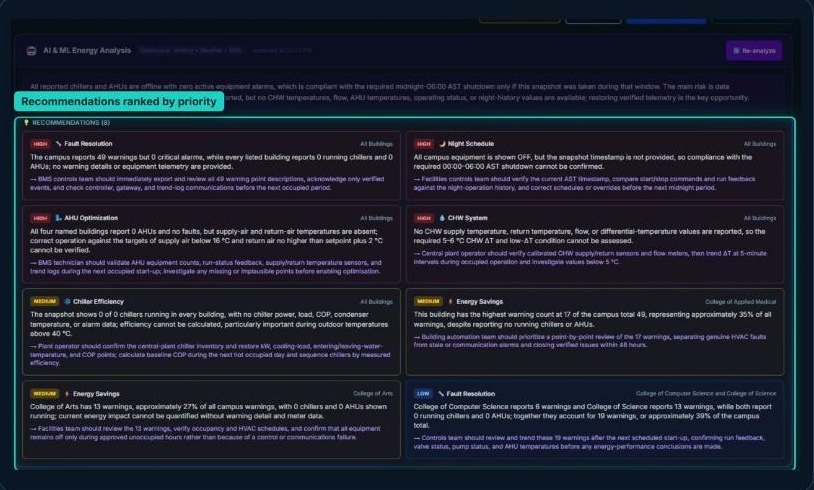
Raise prioritised work orders or recommend control changes.
Verify
Confirm the fix worked and track the result.
Operators see causes, not just alarms
- Rules and analytics run continuously on BMS data
- Symptoms are grouped by likely root cause
- Findings are ranked by impact and urgency
| Equipment | Typical faults detected |
|---|---|
| Air-handling units | Simultaneous heating and cooling, valve leakage, sensor drift, damper faults |
| Chillers & plant | Low ΔT, short cycling, poor staging, setpoint drift |
| Pumps & VFDs | Command and feedback mismatch, running against a closed valve |
| Energy meters | Voltage and current imbalance, low power factor, missing data |
From alarm to closed work order, automatically
Alarm or fault
A BMS alarm, analytic fault or meter event.
Validate and prioritise
Duplicates merged; severity and impact scored.
Work order
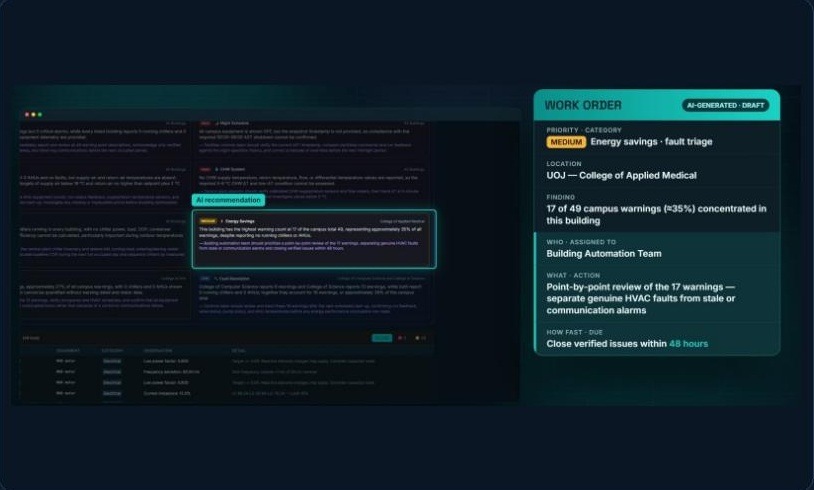
Drafted with asset, cause, action and deadline.
Escalate
Routed to the right team with response timers.
Close and verify
Technician feedback and BMS data confirm the fix.
CMMS integration
Two-way sync with your CMMS or ticketing tool, so BMS findings become tracked jobs.
Fewer duplicate tickets
Related alarms are grouped into a single issue with full context for the technician.
WhatsApp and email notifications
Every alert reaches the person who acts on it, in Arabic or English, ranked by severity.
Analytics and dashboards for every project
- Energy. Consumption against baseline, by project and system.
- Comfort. Temperature and air quality kept within defined limits.
- Availability. Equipment uptime, open faults and work-order status.
Agents propose, people approve
Every action is logged.
- Scan the BMS. Reads live screens, trends and alarms.
- Detect faults. Finds anomalies and off-hours runs.
- Draft work orders. Owner, action and deadline included.
- Write the reports. Summaries ready for review.
- Daily KPI summary
- Fault and issue report
- Energy-saving opportunity report
- Measurement & verification report
Results you can audit, secure by design
Continuous testing and commissioning
Functional performance tests run automatically on chiller plant and air-handling systems, with pass, warn and fail results per project.
Measured and verified savings
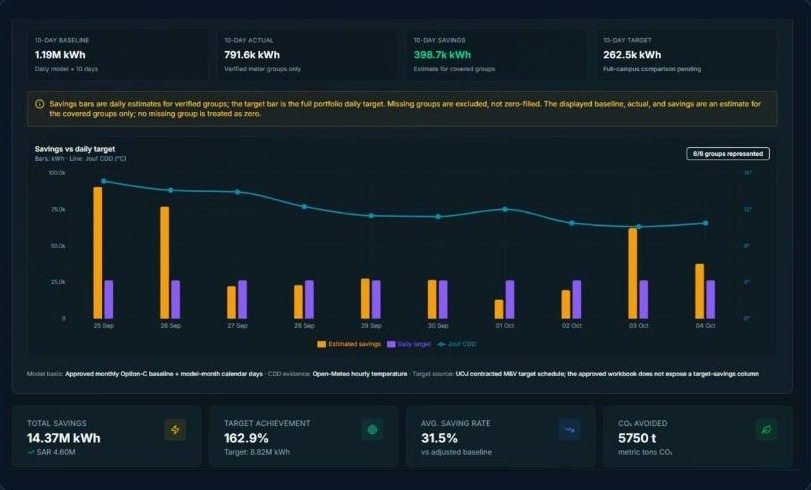
Savings are calculated against a baseline so results are transparent and auditable.
Electrical and meter health
Power factor, voltage and current imbalance and frequency are checked against recognised limits.
Encrypted communications
Data protected in transit and at rest.
Role-based access
MFA and single sign-on supported.
Full audit trail and backup
Every user and agent action is recorded, with automated backup and fast recovery.
- ASHRAE GL 1.1
- ASHRAE 202
- IPMVP Option A
- IPMVP Option C
- NEMA MG-1
- IEC
- IEEE
- BACnet
- Modbus
- OPC UA
- MQTT
- Niagara
- REST APIs
From inspection to work order to verified savings
We start with one building
Assess
Site survey, BMS and data review.
Connect
Secure connection and point mapping.
Pilot
One building: baseline and first findings.
Scale
Portfolio roll-out and continuous service.